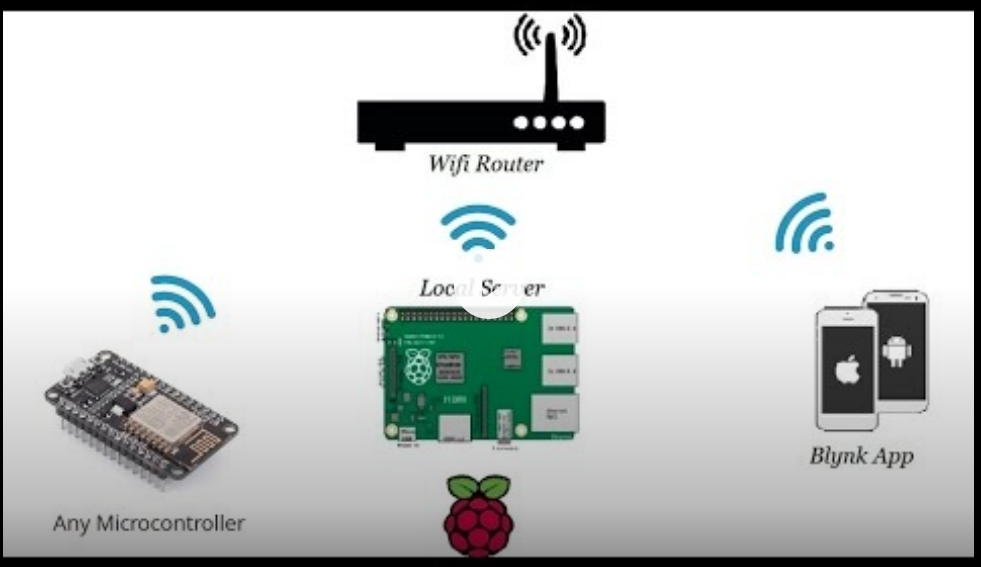
Setting up a Local Blynk server
Contents:
• Basics of Blynk Architecture
• Blynk App download to smartphone
• Setup the user interface
• Setting up local blynk server.
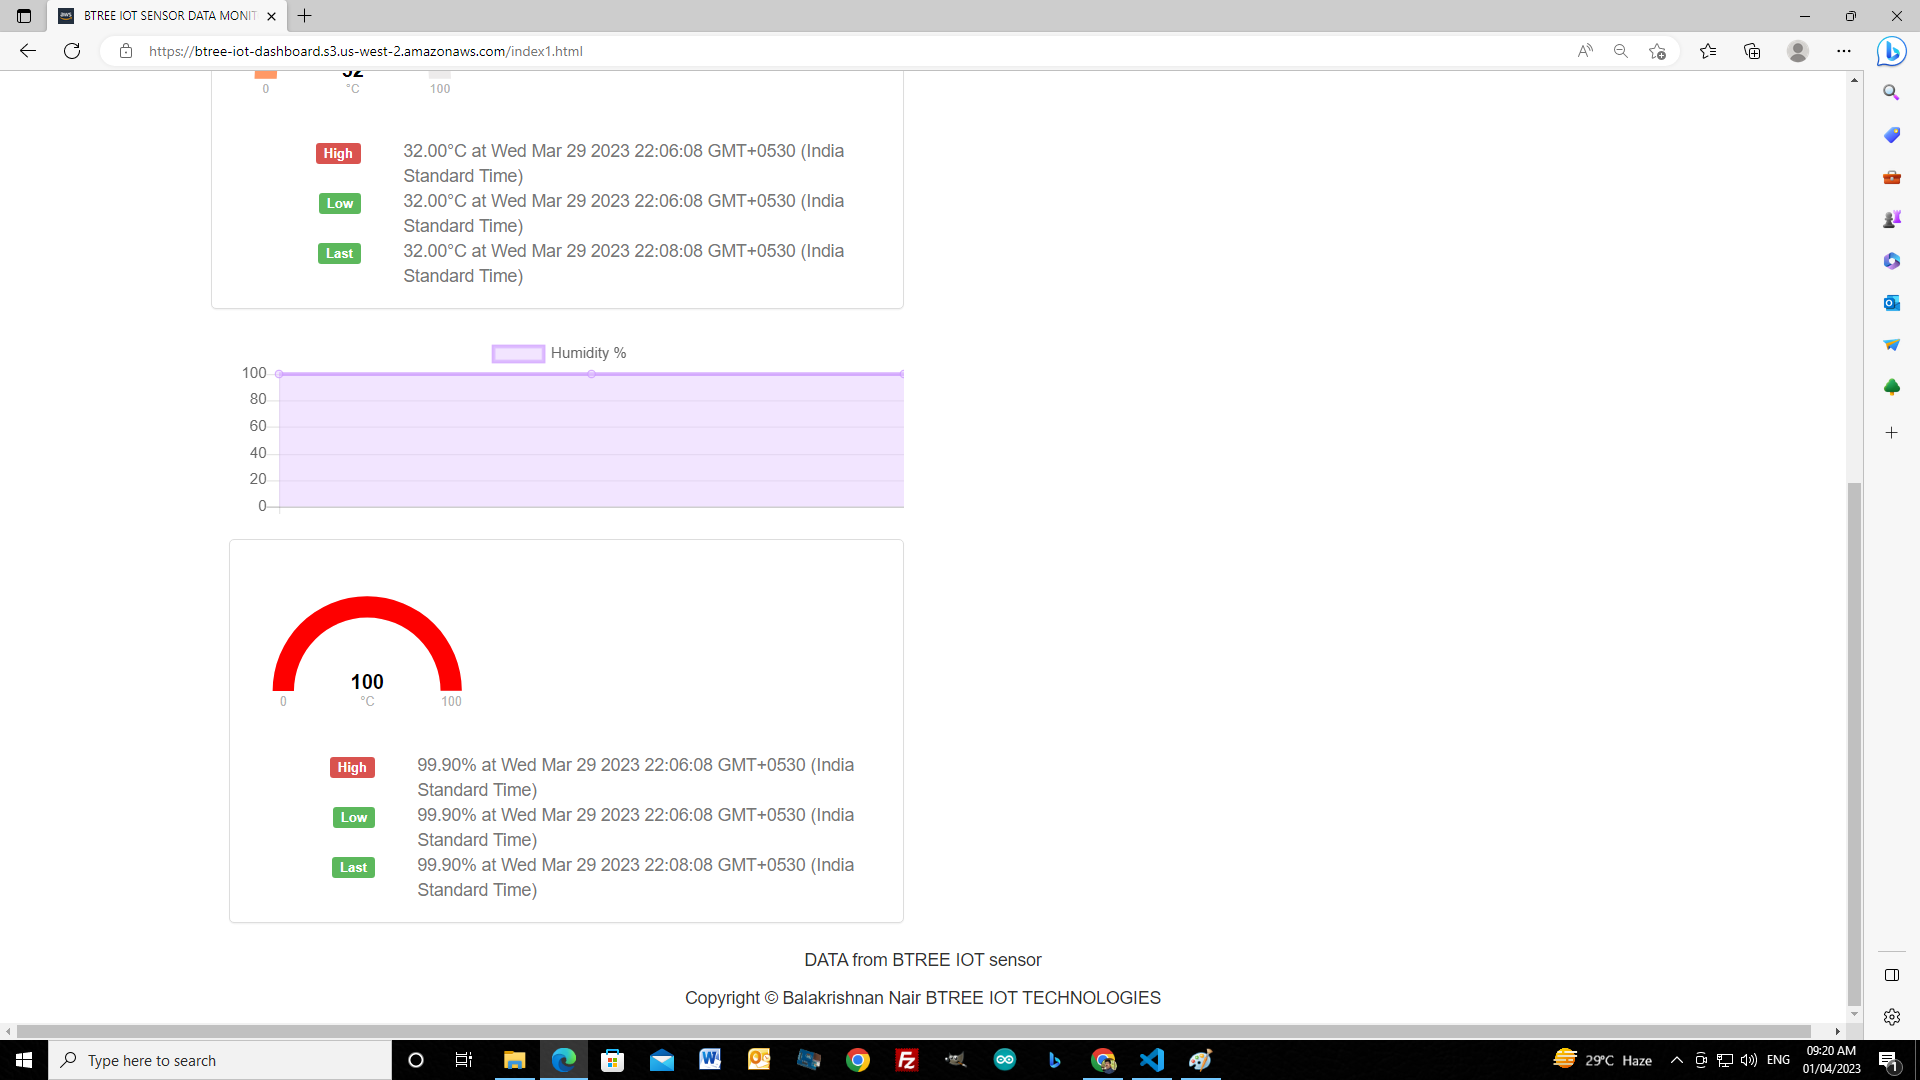
End-to-end IoT sensor data live visualization and a Cooler / Heater control using AWS IoT Cloud.
This project is to capture temperature and humidity data from a BTREE IoT SENSOR and send it to a DynamoDB table in AWS cloud server and simultaneously display a live chart on a website url using AWS IoTcore, AWS DynamoDB, AWS S3 website, NodeJS and ChartJS. It also controls a Cooler and a Heater automatically based on the current values of temperature and humidity
NodeMCU with DHT22 --> AWS IoT --> DynamoDB --> NodeJS --> ChartJS --> AWS S3-website.